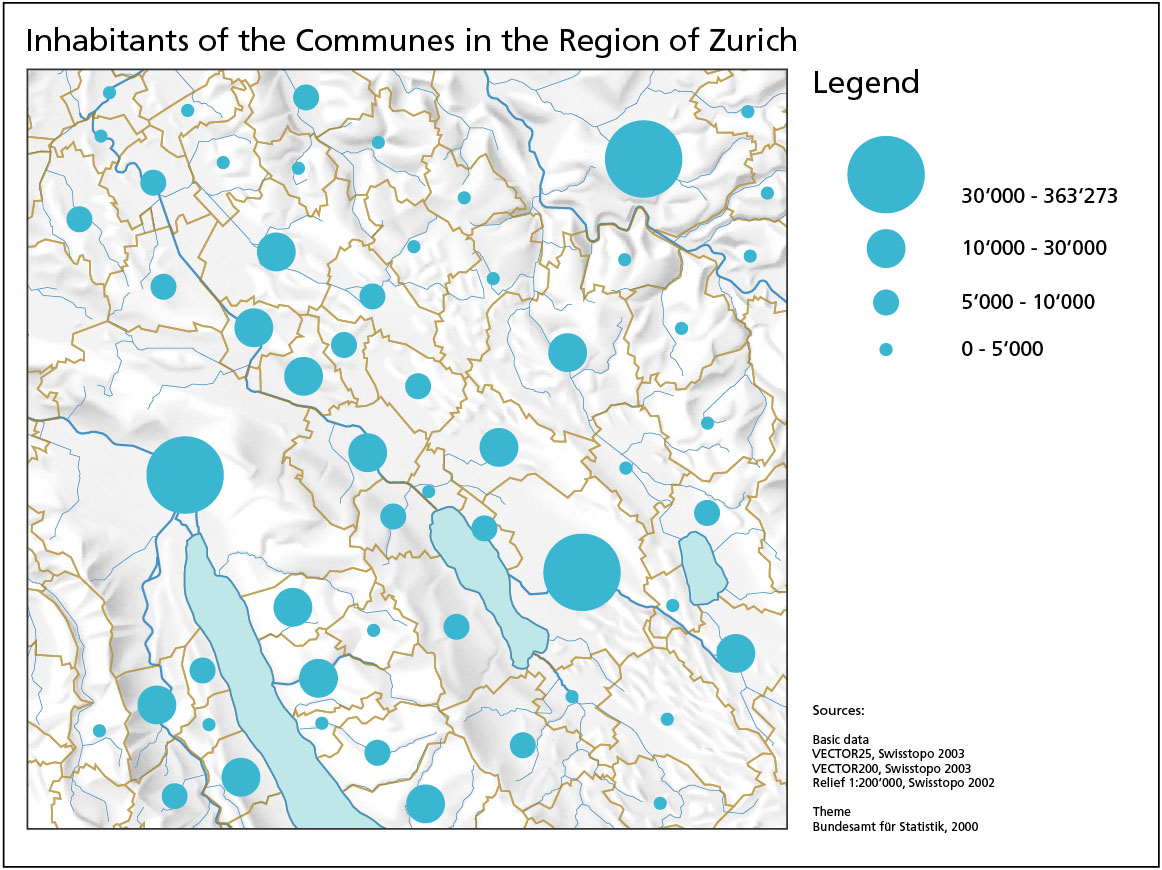
In Range graded proportional circle maps only a set number of circle sizes are used to depict the variable (unlike the Continuously variable, where an indefinite amount exist). This map shows inhabitants of the communes of Zurich, Switzerland. The disadvantage of having a set amount of circles represent the entire data is that the circles do not represent actual inhabitants in those locations, but rather a range. So while circles of equal size might seem to indicate equal inhabitants (for example the 3 largest circles on this map), they in face represent varying inhabitants, anywhere from 30,000 to 300,000 inhabitants. This is a huge difference when one takes into account that the rest of the circles represent the range from 1 to 30,000 inhabitants.
No comments:
Post a Comment