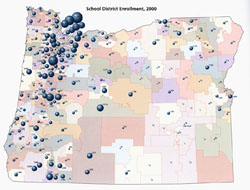
Continuously variable proportional circle map shows a circle whose size is directly proportional to the value of the data measured, where increase in the data is shown by slow increase in value. In the map above, school enrollments is the data interest, represented by circles who are proportional to the amount of students enrolled in that specific location (where the circles hover over). A problem with this map type is when a concentration of circles, like seen in the Washington-Oregon areas, start to clump up. This can make overlap really hard to avoid and hence represent the data correctly.
No comments:
Post a Comment